The Investment Science website is up! This is
great news for everyone interested in following the developments of
Investment Science. You will find the site at
http//www.investmentscience.com The site contains general
information about the field of investment science, descriptions of
several applications, links to related sites that can assist with
projects, and even back issues of these newsletters. Soon there
will be interactive demonstrations and downloadable software
similar to that which many of you obtained in the two-day course.
Please have a look at the site and show your colleagues. Your
comments on the site are welcome.
Investment Science for Industry was given this
past April to a full capacity group of attendees. As in the past
there was a great deal of productive interaction, and the course
continues to evolve based on feedback from participants and from
our own continuing research and project work. At the past session,
some new examples were presented and a new break-out session on
simulation was established. The next course will be September
16-17. Please refer colleagues to it (through the website
http://www.stanford.edu/~luen or to the investmentscience.com
website mentioned above).
A project's real value depends on the project's
cash flows and on how those cash flows are statistically related to
market variables¹ . It is, therefore, important to understand how
to estimate the relevant statistical relations, and we review the
basics here because beginning students often do it incorrectly,
leading to large errors in valuation. The essential statistical
relations are expected values, variances, and covariances of cash
flows and market prices. Often correlation (obtained from variances
and covariance) is used as well. The variances and covariances can
be estimated from historical data, but it must be done
properly.
As an example, suppose that a project's revenue
will be directly determined by the price of 16 meg DRAM at a future
date (or dates). DRAM is not a commodity that can be meaningfully
stored (since it quickly becomes obsolete) and accordingly there is
no liquid market for it. Therefore, DRAM price is not a pure market
variable. On the other hand, it is clear that the price of DRAM
(and expectations of its future price) is reflected in some actual
market prices, such as the stock price of Micron Technology, Inc.,
a company that is a major producer of DRAM. In other words, the
price of DRAM and the stock price of Micron Technology are probably
correlated.

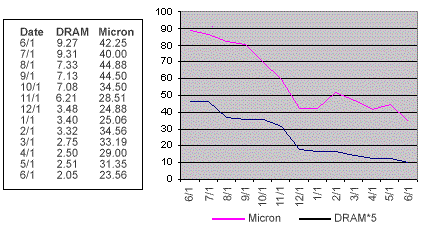
Figure 1. Monthly values of the price of DRAM and Micron
Technology stock.
We can verify this conjecture by looking at the
data in Figure 1 which shows the prices of 16 meg DRAM (as
determined by negotiation between a large buyer and a large seller)
and Micron Technology stock from June 1997 to June 1998. Casual
inspection of the corresponding graph indicates that there is a
tendency for the two to move together.
Correlation can be estimated from this data² .
Frequently, students do this by estimating the direct variances and
covariances of the data.
Let us see how the typical student
calculation would be made. If there are n historical
values  of the price of Micron Technology stock
price, the direct expected value of these values, is estimated by
simply averaging the historical values. In equation form this
estimate is

The data represented in Figure 1 consists of 12
monthly values. Using the values for Micron Technology stock price
in the averaging formula, we find the estimate of the average stock
price to be $33.56. (This value can be found by using the AVERAGE
funciton in Excel.) The corresponding variance is estimated by
(essentially) averaging the squared differences of the historical
values from the expected value. Or, equivalently,

where n -1 is used in the denominator
(instead of n ) to account for the fact that the estimate of the
expected value, rather than the true expected value, is used on the
right hand side. For the data of Figure 1, the variance of the
Micron Technology stock price is 55.47 (dollars squared). (This
value can be obtained by using the VAR function in Excel.) The
standard deviation is defined to be the square root of the
variance, which in this case would be estimated to be the square
root of 55.476, or $7.44.
Likewise, if there are n corresponding
values  of DRAM price, the direct covariance of the
Micron Technology stock price and DRAM is estimated as

which for the data of Figure 1 is 15.23
(dollars squared). (This value can be obtained by using the COVAR
function of Excel and multiplying the result by n/(n-1) =
13/12.)
The correlation between p and d
is equal to the covariance divided by the product of the standard
deviations, which for the data of Figure 1 works out to be .76 =
76%. This is a pretty high value of correlation and a student might
conclude that the price of DRAM is nearly a market variable and
accordingly should be heavily discounted in a cash flow
valuation.
But this conclusion, and the procedure used to
reach it, is not appropriate for deducing correlation for purposes
of determining the economic value of the project whose cash flows
are determined by DRAM prices. The correct correlation value is
quite different than the 76% value.
Correct Method. The procedure discussed
above is flawed because the statistical quantities that are
relevant for valuation should be based on the period-by-period
percentage changes in the prices (or cash flows), not the direct
values. More exactly, it is the period-by-period difference in the
logarithm of prices or cash flows that should be used. Consider,
for example, a stock price that increases exponentially (or
geometrically) with no variability - say

An historical sequence of prices of this stock
will have values, most of which will differ from the average value.
Hence, such a price sequence will yield a variance estimate that is
positive if the above procedure is used. However, the percentage
change is

is constant - as is the logarithmic
difference

Hence, the variance determined this way is zero
as it should be since there is no uncertainty.
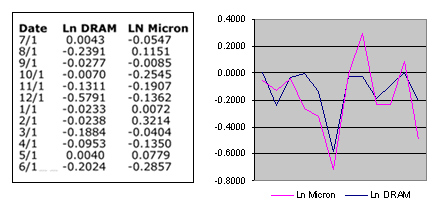
For the DRAM example, we should first convert
the sequences of DRAM prices and Micron stock prices to sequences
of their change in logarithms. Note that these sequences have only
12 elements instead of 13. The resulting sequences are plotted in
Figure 2. The correlation between the two sequences is quite
apparent.

Figure 2. Monthly changes in the logarithms of the prices of
DRAM and Micron Technology stock.
We can now apply the estimation formulas
to this set of data. This leads to a correlation coefficient
(between the log of DRAM price and the log of Micron Technology
stock price) of 24% which is much smaller than the 76% figure
obtained earlier. This value of 24% is the correct value for the
standard method of valuation. Since it is relatively small, we
expect that the discount rate that should be applied to DRAM prices
is substantially lower than the expected growth rate of Micron
Technology stock. Of course, other stock prices are also correlated
with the price of DRAM and these should be used as well in a
complete analysis.